Why Legacy Monitoring Failed
Before DURESS we had 300+ alerts per week, MTTR measured in hours, and resolution was a guessing game between API gateways, fraud microservices, and databases. The noise drowned the signal.
Symptoms
- 300+ alerts/week with 95% noise.
- Late detection: spikes noticed 18 minutes after users.
- Root cause investigations took 90 minutes.
- Separate dashboards per team created silos.
- MTTR averaged 2h 15m even for simple issues.
Underlying Causes
- No shared definition of “healthy service”.
- Metrics focused on resources, not customer experience.
- Alert thresholds set near catastrophic levels.
- Teams overwhelmed by paging and ignored signals.
- Lack of correlation slowed triage.
The DURESS Focus
Implementation Timeline
Baseline Reality
Captured normal operating ranges for all five signals across every critical service. No alerts yet, just data.
Threshold Alignment
Engineering, product, and ops defined warning/critical thresholds off the baseline. Conservative values guaranteed early detection.
Alert Consolidation
Decommissioned 180 legacy alerts and routed DURESS alerts to a single channel. Signal-to-noise flipped from 5% to 80%.
Single Pane of Glass
Built a unified dashboard showing Duration, Rate, Errors, System Saturation, and Utilization side-by-side.
Game Days & Drills
Simulated outages surfaced dependency blind spots and trained teams to respond in DURESS terms.
The Dashboard
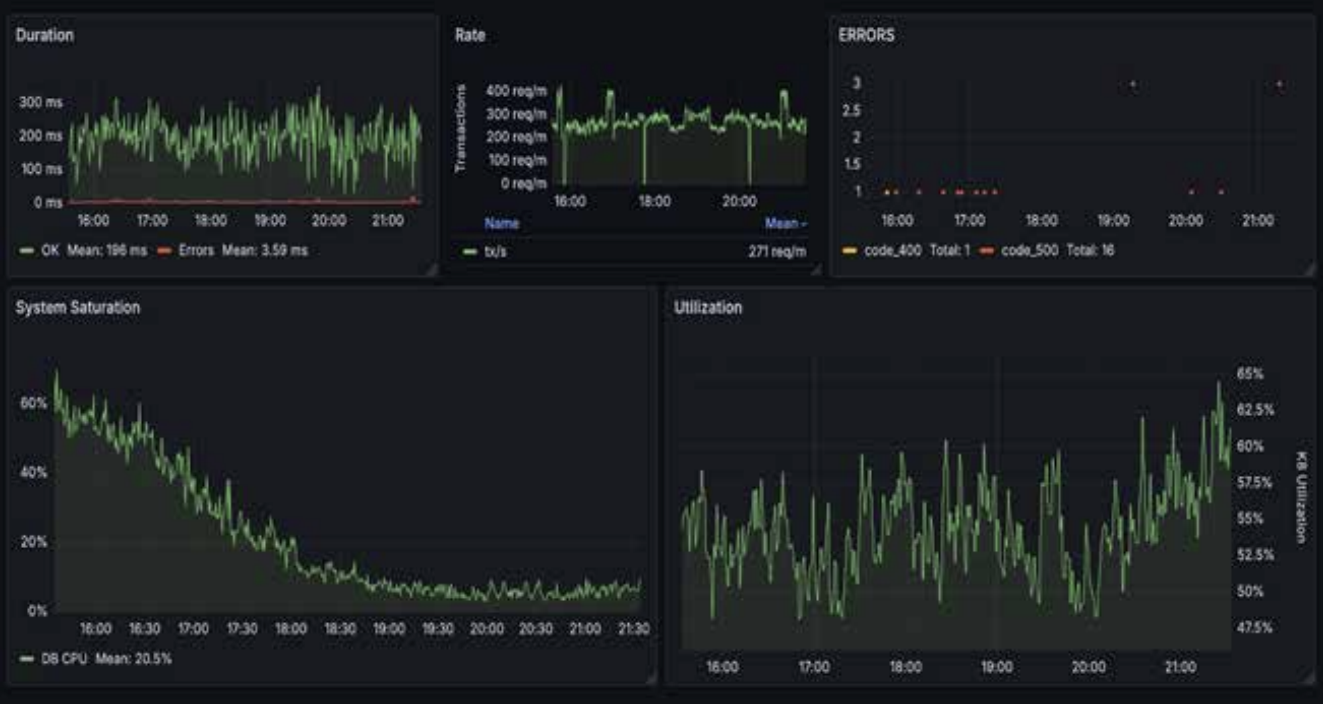 Duration, Rate, Errors, System Saturation, and Utilization in a single glance, no tab hopping.
Impact
| Metric | Before | After | Change |
|---|---|---|---|
| Mean Time to Resolve | 2h 15m | 8.5m | 94% faster |
| Detection Time | 18 minutes | 45 seconds | 96% faster |
| Incidents / Month | 14 | 3 | 79% reduction |
| On-call Page-outs | 24 | 2 | 92% reduction |
| Customer Downtime | 800 minutes | 42 minutes | 95% reduction |
What Changed vs What Didn’t Work
- Five DURESS signals gave every team a shared language for service health and eliminated guesswork.
- Correlation became effortless. Seeing Duration, Error, and Saturation spike together cut investigation time from 90 minutes to minutes.
- Alert thresholds turned strategic: triggering at 70% capacity bought time to respond before customers noticed.
- Regular game days exposed dependency blind spots that never surfaced during steady state.
- Culture change mattered most; two weeks of engineering work paired with four weeks of cross functional alignment.
- Skipping baseline collection led to guesswork, bad thresholds, and renewed alert fatigue.
- Alerting at the cliff (99% utilization) meant customers felt pain before teams could react.
- Running legacy metrics alongside DURESS split focus and reintroduced confusion.
- Ignoring saturation blinded us to the leading indicator that drives Duration and Error spikes.
- Treating DURESS as a project instead of practice stalled improvements. Quarterly reviews and drills are mandatory.
How to Adopt DURESS?
The Win
Chaos didn’t disappear. Blindness did.
Systems still fail, but DURESS lets us see the failure in 45 seconds, resolve it in under 10 minutes, and keep customers unaware anything happened. We traded heroics for reliable sleep.